±3% Mean Bias: What Wearable Heart Rate Accuracy Really Means
±3% Mean Bias: What Wearable Heart Rate Accuracy Really Means
Wearable heart rate accuracy is genuinely good for resting readings and long-term trends, with a mean bias of roughly ±3% across validation studies, but it gets shakier during rapid intensity changes and high-intensity intervals. That number is the headline, but it’s also the ceiling. Below it, individual devices, activities, and even your skin tone can push error rates well past that average, which is why treating your wrist tracker as a training compass, not a medical instrument, matters.
TL;DR:
- Wearable heart rate sensors have a mean bias of about ±3% in controlled conditions, but error rates can increase significantly during rapid intensity changes and high-intensity intervals.
- Factors such as motion artifacts, device fit, skin tone, tattoos, and wrist biomechanics heavily influence real-world accuracy, especially during dynamic activities.
- Validation studies show substantial variability among devices, with high-end fitness trackers outperforming cheaper models during steady effort, but all devices struggle with abrupt heart rate shifts.
- Wearables are most reliable for tracking resting and steady-state heart rates but should be used cautiously during irregular or high-intensity workouts, with clinical validation preferred for medical concerns.
- Pairing wearable data with clinical evaluation and using exported timestamps improves accuracy and safety, especially when monitoring for symptoms such as chest pain, fainting, or unusually high or low heart rates.
Table of Contents
- How Wearable Heart Rate Sensors Actually Work
- What the Research Actually Shows About Accuracy
- What Actually Changes Your Accuracy in Real Life
- Getting the Most Reliable Reading From Your Device
- Where Wearables Stop and Medical Care Starts
- How Glpcare Uses Wearable Data in Clinical Weight Care
- A Realistic Take on Trusting Your Wrist
- Ready to Pair Continuous Tracking With Clinical Support?
- Primary Sources and Further Reading
- Sources
- FAQ
How Wearable Heart Rate Sensors Actually Work
Almost every wrist-worn tracker on the market, from budget bands to premium smartwatches, uses a technology called photoplethysmography, or PPG. Green or infrared LEDs shine light into the capillaries under your skin, and a photodetector measures how much of that light bounces back. Blood absorbs more light when it surges through your vessels with each heartbeat, so the sensor detects a rhythmic pattern of light absorption and translates it into beats per minute.
Chest straps and clinical ECG monitors work differently. They read the electrical signal your heart generates directly, through electrodes touching your skin. That’s a cleaner, more direct measurement, which is why Cleveland Clinic and most cardiologists consider ECG-based monitors the accuracy benchmark against which every optical wearable gets judged. PPG is an indirect proxy for what ECG measures directly, and that gap is where most of the error creeps in.
Three technical factors explain why your watch sometimes disagrees with reality:
- Sampling rate: how frequently the sensor takes a light reading; lower rates miss fast changes in blood flow.
- Averaging and smoothing: most algorithms blend several seconds of data into one number, which produces a cleaner-looking trend line but erases short spikes and dips.
- Motion artifacts: arm swing, wrist rotation, and band slippage scatter the light path, and the algorithm has to guess which signal is your pulse and which is noise.
That last point deserves emphasis, because it’s the single biggest source of real-world error. When you’re sitting still, the LED has a stable, well-lit patch of skin to read, and accuracy climbs close to ECG levels. The moment you start swinging your arms during a sprint or throwing punches in a boxing class, the sensor is fighting through motion noise while also trying to track a heart rate that’s changing by the second. Research on PPG’s transient-state performance confirms that smoothing algorithms, while useful for trend accuracy, actively mask the sharp spikes that matter most in interval training. Your watch isn’t lying to you. It’s making a statistical trade-off between showing you a stable number and showing you the truth in real time, and it usually chooses stability.
What the Research Actually Shows About Accuracy
The most useful number in this entire field comes from a living umbrella review covering 249 validation studies of consumer wearables. It found a mean bias of approximately ±3% for heart rate measurement, alongside a striking finding for arrhythmia detection: pooled sensitivity of 100% and specificity of 95% in some of the clinical studies reviewed.
±3% mean bias is the closest thing this field has to a consensus figure. It reflects performance averaged across dozens of studies, devices, and conditions, which means your specific watch during your specific workout could land noticeably outside that range.
That headline number is encouraging, but it’s an average across wildly different conditions, and averages hide the details that matter for your actual workout. A 2026 instrument validation study tested 10 commercial wearables across different climates and activities and found real separation between devices. The Google Pixel Watch 2 demonstrated similarly strong accuracy though slightly less precise than the top performer. Other devices in the same climate and activity study showed considerably larger errors, particularly during intermittent walking, while ambient temperature made no significant difference to accuracy across the moderate ranges tested.
That last detail surprises a lot of people. You’d expect a hot, sweaty run to throw off an optical sensor more than a cool one, but the data says climate isn’t the real problem. Motion irregularity is. A separate 2025 study of 16 commercial PPG monitors backs this up: overall agreement with ECG was excellent in steady-state conditions, with intraclass correlation coefficients above 0.90 in some protocols, but that agreement degraded as exercise intensity increased, especially during high-intensity interval training. Some devices held up better than others under that stress, but the pattern across the board was the same: steady effort produces reliable numbers, and abrupt intensity changes do not.
A few consistent patterns emerge from this body of research:
- Resting and steady-state heart rate readings generally align closely with ECG reference values.
- Accuracy degrades measurably during HIIT, sprint intervals, and any activity with sudden intensity shifts.
- Chest-worn research-grade devices generally outperform wrist-worn consumer devices during dynamic movement transitions.
- Device-to-device variability is substantial. A high-end watch and a budget band tested in the same study rarely perform identically.
The bigger problem underneath all of this is that these studies don’t always test the same way. The INTERLIVE Network’s expert statement called out methodological inconsistency as a primary barrier to comparing wearable validation research, and published a checklist covering six domains: population, reference criterion, index measure, testing conditions, data processing, and statistical reporting. Without that kind of standardization, one study’s “highly accurate” and another’s “highly accurate” can mean genuinely different things. INTERLIVE’s recommendation is straightforward: before trusting a validation claim, check whether the study specifies its testing population, uses ECG or a comparable criterion measure, and reports its statistics with enough transparency to be reproduced. A living umbrella review covering hundreds of studies also notes that only a fraction of consumer devices on the market have adequate independent validation at all, which is worth remembering the next time a product page claims “clinical-grade accuracy” without a citation attached.
What Actually Changes Your Accuracy in Real Life
Not all workouts stress a wearable sensor the same way, and understanding the difference tells you exactly when to trust the number on your wrist and when to treat it as a rough estimate.
Resting heart rate and steady-state cardio, think a consistent-pace jog, a spin class holding one cadence, or an easy swim, give the sensor its best working conditions. Blood flow is predictable, your wrist movement is rhythmic and repetitive, and the algorithm has time to lock onto a clean signal. This is where wearables perform closest to their published averages.
Transient and irregular movement is a different story. HIIT circuits, boxing, weightlifting, and any sport with unpredictable arm motion (tennis, basketball, rock climbing) create exactly the kind of motion artifact that PPG sensors struggle to filter out. Your heart rate might spike from 110 to 160 in fifteen seconds during an interval, and by the time the algorithm’s averaging window catches up, the interval could already be over.
Several individual factors compound this beyond activity type alone:
- Fit and placement: a loose band or one worn too far down the wrist introduces gaps between the sensor and skin.
- Skin tone and tattoos: darker pigmentation and dense ink can absorb or scatter light differently, affecting signal quality for some optical sensors.
- Body hair and sweat: both can interfere with consistent skin contact, though sweat also improves conductivity for electrode-based sensors on the same device.
- Wrist biomechanics: bony wrists or unusual tendon movement patterns can shift the sensor’s contact point during exercise.
Environmental conditions, meanwhile, matter far less than most people assume. The 2026 climate and activity study found that temperature within moderate, comfortable ranges had no significant effect on accuracy, which reframes the whole conversation. It’s not the weather undermining your reading. It’s how much and how unpredictably your wrist is moving.
Pro Tip: If you’re chasing a precise number during an interval workout, don’t stare at the live reading mid-rep. Check it during the recovery period between intervals, when your wrist is relatively still and the sensor has a few seconds to stabilize.
Getting the Most Reliable Reading From Your Device
You can’t change the physics of PPG sensing, but you can control most of the variables that determine how well it works for you.
- Position the band correctly. Wear it about a finger’s width above your wrist bone, snug enough that it doesn’t slide but not so tight it restricts blood flow.
- Warm up before you check trends. Give the sensor thirty to sixty seconds of steady movement before relying on the number, especially first thing in the morning when circulation is still ramping up.
- Use longer averaging windows for trend tracking. If your device or app lets you adjust the smoothing interval, a longer window (30 to 60 seconds) sacrifices second-by-second precision for a more reliable long-term picture, which is exactly the trade-off worth making for weekly progress tracking.
- Cross-check with a chest strap when precision actually matters. If you’re dialing in specific training zones or investigating an unusual reading, a brief side-by-side comparison against a chest strap or a supervised ECG gives you a real benchmark.
- Export your data with timestamps. If you ever need to discuss an irregular reading with a clinician, raw exported data tied to specific times and activities is far more useful to them than a single daily summary number.
The distinction between training use and health use matters more than most people realize. For adjusting your workout intensity or tracking whether your resting heart rate is trending down over months, your wearable’s trend data is genuinely reliable. For anything that resembles a medical concern, a single suspicious reading, chest discomfort, unexplained fatigue, that’s a different category entirely, and it calls for professional monitoring rather than an app notification.
Pro Tip: Screenshot or export a week of resting heart rate data before a doctor’s visit rather than trying to describe “it felt high sometimes.” Clinicians work far better with a timestamped pattern than a vague memory.
Where Wearables Stop and Medical Care Starts
A wearable heart rate monitor is not a diagnostic device, and no validation study claims otherwise. It’s a screening and awareness tool, and the difference between those two categories is exactly where a lot of people get into trouble.
Arrhythmia detection features on modern watches have shown real promise in research, with some clinical studies reporting pooled sensitivity of 100% and specificity of 95% for irregular rhythm alerts. That’s a strong signal, but it applies to specific detection algorithms under specific test conditions, not a blanket guarantee that your device will catch every abnormal beat or that every alert it generates is a true positive. False alarms happen. So do missed transient events, particularly brief irregularities that resolve before the averaging window even registers them.
Certain signs should send you to a clinician regardless of what your watch says, or doesn’t say:
- Chest pain, pressure, or tightness, especially if it comes with shortness of breath
- Fainting, near-fainting, or sudden dizziness
- A resting heart rate sustained above 180 bpm without a clear cause like intense exercise
- A very low heart rate paired with symptoms like confusion, weakness, or lightheadedness
If you do bring wearable data into a medical conversation, raw exported readings with timestamps and activity notes are more useful to a clinician than an app’s daily summary score. Clinicians generally want to see the pattern around an event, not just the number at the moment you noticed something felt off.
How Glpcare Uses Wearable Data in Clinical Weight Care
Glpcare treats a wearable heart rate reading the way the research above suggests it should be treated: as a trend signal that adds context to your care, not a standalone diagnosis. The GLP Care Band tracks heart rate, sleep, and activity continuously, feeding that data into a program built around GLP-1 therapy, personalized nutrition coaching, and licensed clinician oversight.
That distinction matters specifically for people managing weight with GLP-1 medications like semaglutide or tirzepatide, where resting heart rate and activity trends can offer useful early signals about recovery and effort, especially when muscle preservation is a priority during weight loss. The GLPCare app uses that band data alongside your logged dosages and habits to generate insights, then routes anything worth a closer look to your clinician rather than leaving you to interpret a raw number alone.
Here’s what that integration actually looks like in practice:
- Continuous heart rate and activity trends feed into your dashboard, not just a single daily score.
- Clinicians review trend patterns during your program, adding professional context that a standalone consumer wearable can’t provide.
- The AI companion translates biometric trends into plain-language guidance about recovery, activity, and pacing.
- Nothing in the system replaces an ECG, a stress test, or an in-person evaluation when symptoms warrant one.
A Realistic Take on Trusting Your Wrist
The most common mistake people make with wearable heart rate data isn’t trusting it too much. It’s trusting it uniformly, treating a number generated during a sprint interval with the same confidence as one generated while sitting at a desk. Those two readings come from completely different accuracy conditions, and the research backs that up clearly.
What the evidence actually supports is a kind of selective trust. Lean on your wearable heavily for resting heart rate trends, recovery patterns, and week-over-week progress. Lean on it much less during HIIT, sports with unpredictable movement, or any moment when a specific number needs to be exact rather than approximately right. That’s not a flaw to be embarrassed about. It’s a known trade-off built into how optical sensors work, and once you understand it, you stop expecting precision the technology was never designed to deliver in those conditions.
The practical move is pairing what your wearable tells you day to day with periodic clinical checks, particularly if you’re on a weight management program where recovery and cardiovascular trends genuinely matter. A watch can flag a pattern worth discussing. It shouldn’t be the thing that closes the loop on whether that pattern is a problem.
— Dominique
Ready to Pair Continuous Tracking With Clinical Support?
If you’ve read this far, you already understand something most fitness tracker marketing glosses over: a wearable is only as useful as the care system built around it. Glpcare’s approach pairs the GLP Care Band’s continuous heart rate, sleep, and activity tracking with licensed clinician support and an AI companion that turns your daily trends into guidance you can actually act on, rather than leaving you to interpret raw numbers alone.
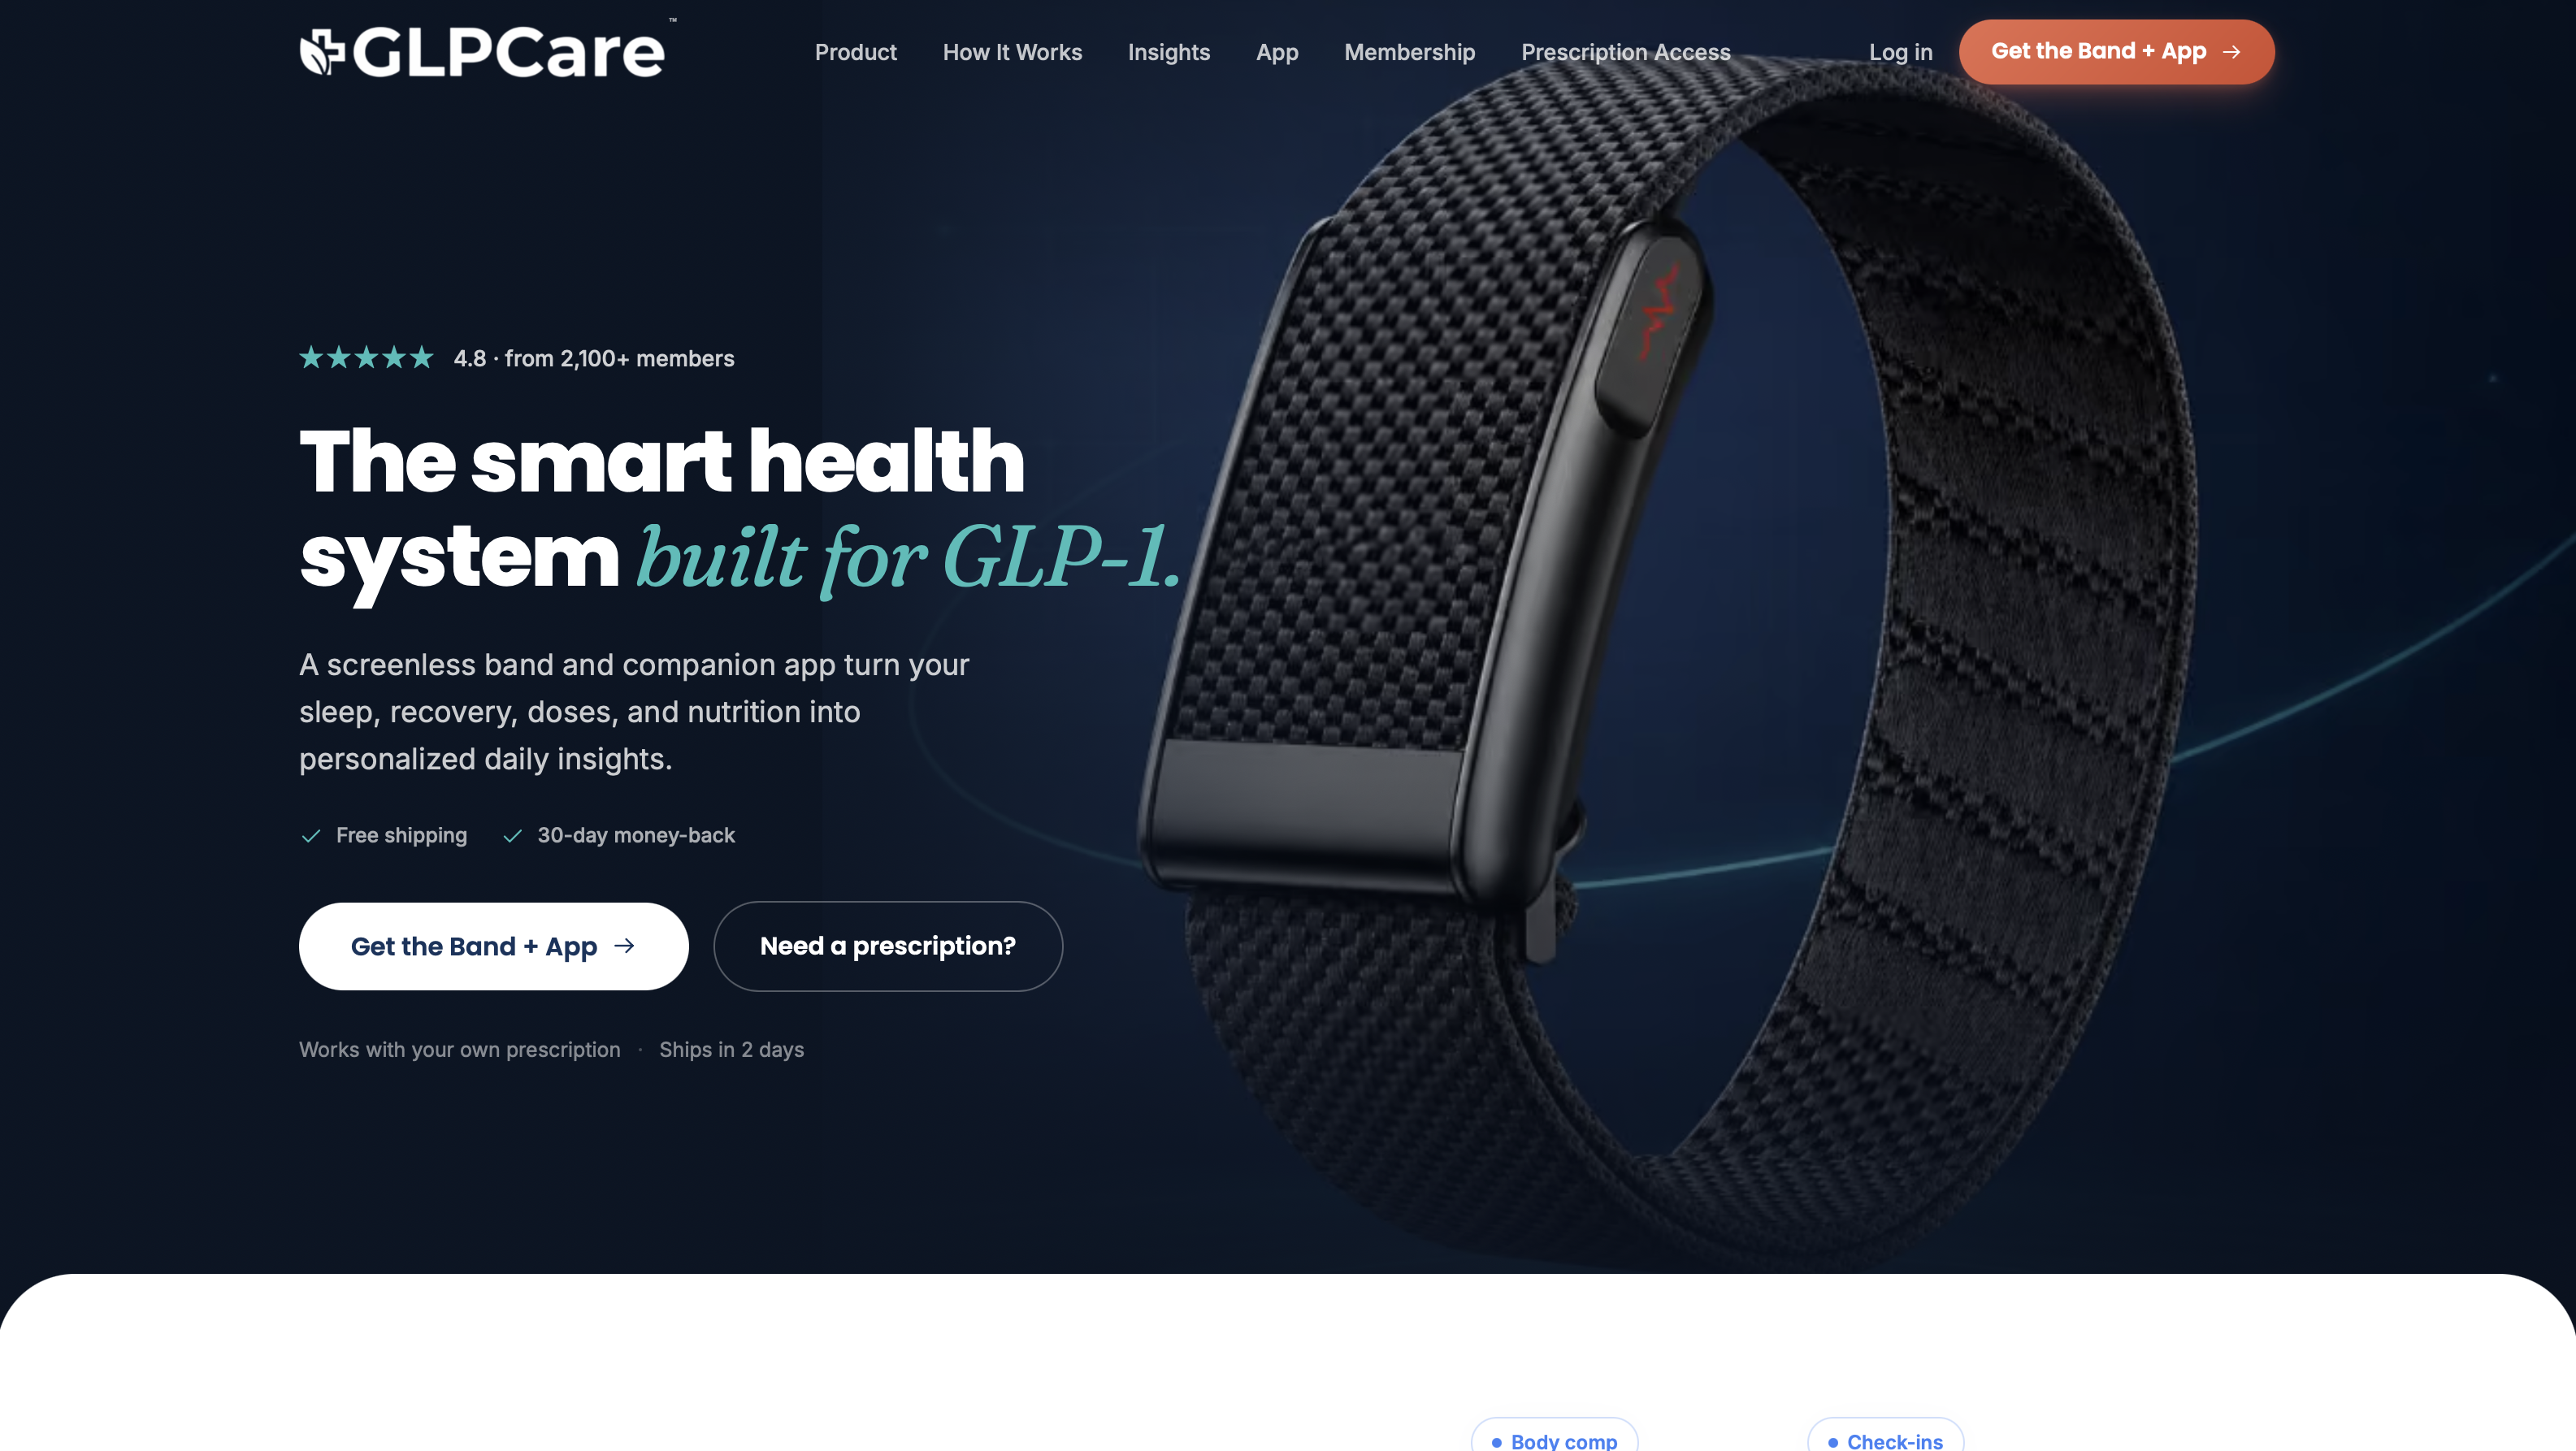
The band itself is currently available through a limited band offer for $89 instead of $179, and it connects directly into Glpcare’s broader GLP-1 program, which combines prescription medication access, personalized nutrition coaching, and ongoing clinical oversight designed to help you manage weight while minimizing muscle loss. If you’re curious whether that kind of integrated, clinician-backed program fits your situation, the fastest way to find out is to take the GLP-1 Readiness Quiz and see what a personalized plan could look like for you.
Primary Sources and Further Reading
The living umbrella review of 249 studies is the field’s most comprehensive synthesis of wearable accuracy data. The INTERLIVE Network statement sets the methodological standard every serious validation study should follow. The 2026 climate and activity validation study and the MDPI intensity study offer the most current device-level performance data. Cleveland Clinic’s heart rate monitor explainer grounds the clinical context for readers weighing wearable data against professional care.
This article is general information, not a substitute for advice from a qualified doctor. Consult a qualified healthcare professional about your own circumstances before acting on anything here.
Sources
- Keeping Pace with Wearables: A Living Umbrella Review of Systematic Reviews Evaluating the Accuracy of Consumer Wearable Technologies in Health Measurement
- Recommendations for determining the validity of consumer wearable heart rate devices: expert statement and checklist of the INTERLIVE Network
- Are We Really Training at the Desired Intensity? Concurrent Validity of 16 Commercial Photoplethysmography-Based Heart Rate Monitors
- Heart Rate Monitors: How They Work
FAQ
What is the most accurate wearable device for heart rate?
No single consumer device is universally “most accurate.” Validation studies show devices like the Fitbit Charge 6 and Google Pixel Watch 2 performing strongly in steady-state conditions, with mean absolute errors under 5 bpm, but accuracy varies by activity and individual fit.
Do cardiologists recommend smartwatches?
Cardiologists often view smartwatches as useful screening tools for trends and irregular rhythm alerts, but they consistently point to ECG-based monitoring as the accuracy standard for actual diagnosis.
Is 193 bpm bad when exercising?
A very high heart rate during intense exercise can be normal for younger, highly conditioned individuals near their maximum heart rate, but it’s worth discussing with a doctor if it happens unexpectedly at low effort or comes with symptoms like dizziness or chest discomfort.
Can we trust a smart watch’s heart rate?
You can generally trust a smartwatch for resting heart rate and steady-state trend tracking, where mean bias runs around ±3%, but accuracy drops during high-intensity intervals and shouldn’t be relied on for diagnosing a specific cardiac event.